Dashboard: Visual Analytics & User License Insights
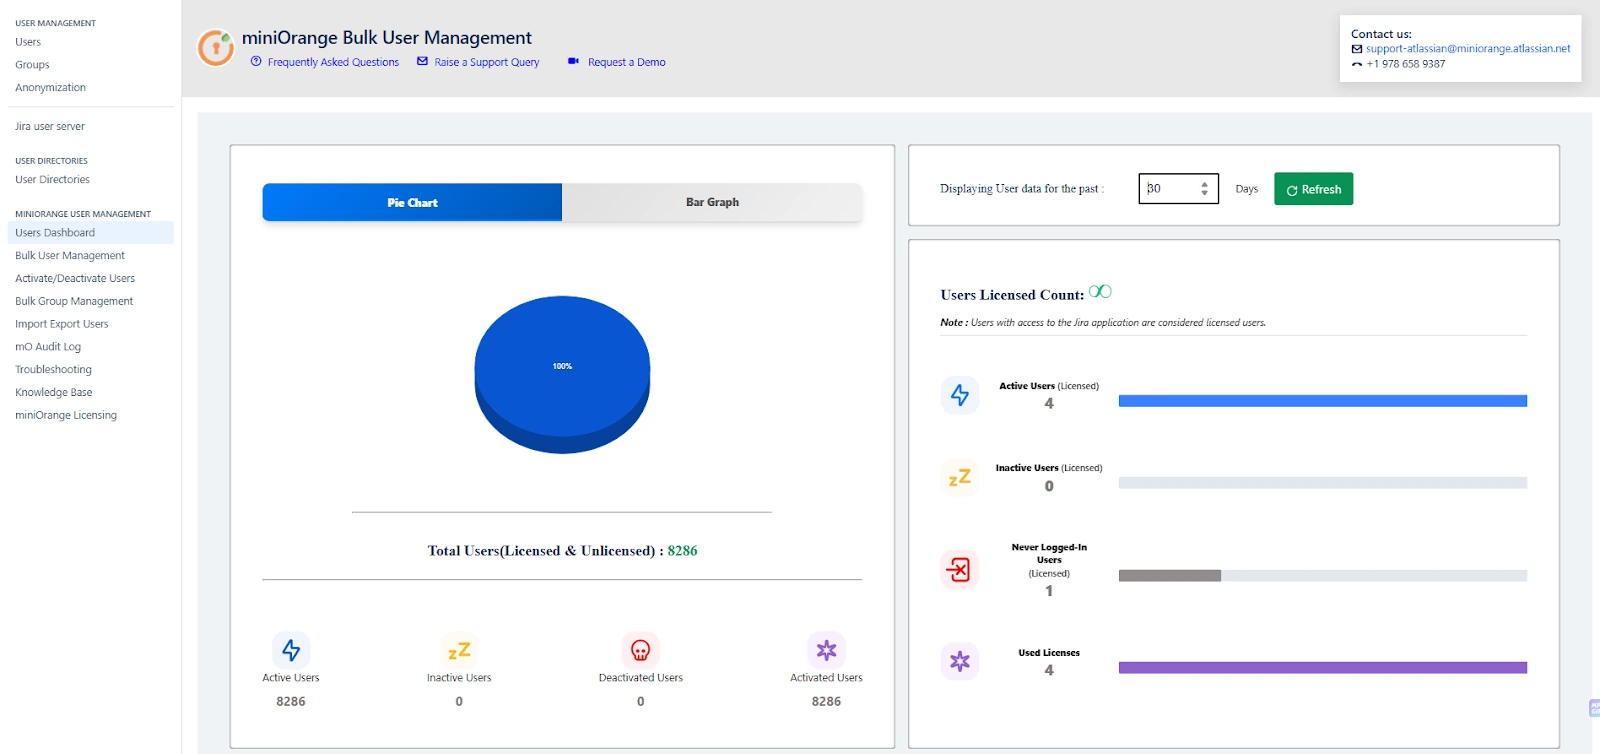
The Dashboard tab in the miniOrange Automated User Management Plugin provides a comprehensive visual overview of your Jira user base. With intuitive graphs and live statistics, it allows administrators to monitor user activity, track license usage, and evaluate user segmentation over a selected time period.
This centralized view helps Jira admins make informed decisions about license optimization, deactivation strategies, and overall system hygiene.
Visual Components of the Dashboard
1. Pie Chart: User Distribution Overview
The pie chart provides a snapshot breakdown of user types based on their current status in the Jira environment:
-
Active Users – Users currently enabled and using the application.
-
Inactive Users – Users who have not logged in during the selected time range.
-
Deactivated Users – Users who have been explicitly disabled or deactivated.
Example Use Case: If the pie chart shows a high percentage of deactivated users (e.g., 96.9%), it may be time to clean up directories or re-evaluate auto-deactivation rules.
2. Bar Graph: User Activity Trends Over Time
The bar graph provides a time-based visual trend of user activity:
-
Track how many users were active, inactive over the selected number of days.
-
Evaluate spikes or drops in login behavior to understand usage patterns, such as after a major release or a policy change.
Example Use Case: If user activity dropped significantly over the past 30 days, it could indicate a misconfigured access rule or a scheduled maintenance window that impacted logins.
User Status Metrics
Below the visualizations, the dashboard lists real-time numeric insights for various user categories:
| Metric | Description |
|---|---|
| Active Users | Total number of currently active users |
| Inactive Users | Users who haven't logged in during the selected time period |
| Deactivated Users | Users explicitly disabled by the admin or automation settings |
| Activated Users | Users who were reactivated within the time period |
Example Use Case: If “Never Logged-In Users (Licensed)” shows a non-zero count, this may indicate underutilized licenses or onboarding issues.
Time Range Selection
Use the "Displaying User data for the past X days" dropdown to choose how far back you'd like to evaluate user behavior. The default is 30 days, but you can adjust it to analyze shorter or longer timeframes depending on your audit or reporting needs.
After changing the date range, click the “Refresh” button to reload updated data across all dashboard widgets.
License Utilization Metrics
The dashboard also includes detailed license insights, which are especially useful for budget-conscious teams.
| Metric | Description |
|---|---|
| Active Users (Licensed) | Licensed users who actively logged in during the selected period |
| Inactive Users (Licensed) | Licensed users who haven’t logged in during the time range |
| Never Logged-In Users (Licensed) | Licensed users who have never logged in since account creation |
| Used Licenses | Number of Jira licenses currently consumed |
| Available Licenses | Remaining licenses available (may show "Unlimited" for open environments) |
Example Use Case: If only 2 of your licensed users are active, but your license count is high, you can use this insight to begin an audit or cleanup process to optimize license costs.
Benefits of the Dashboard
-
Quick Overview of user segmentation and login behavior
-
Graphical Insights for presentations or internal reporting
-
License Optimization through visibility into unused or inactive accounts
-
Audit Readiness by analyzing activation and deactivation trends over time
Sample Scenario
You are preparing for a quarterly license review. By opening the dashboard and setting the display range to 90 days, you quickly find:
-
2 active licensed users
-
1 never logged-in licensed user
-
7181 deactivated users
This helps you justify a potential reduction in user licenses and clean-up inactive or orphaned accounts.