Audit Logs
The Audit Logs tab provides administrators with complete visibility into all operations, automation runs, and user management activities within the Automated User Management app.
It tracks every event, from manual actions to scheduled rule executions, ensuring full traceability and compliance across the system.
Dashboard Overview
The top of the Audit Logs page presents a real-time operational summary that helps administrators monitor recent activities at a glance.
Dashboard Summary Cards
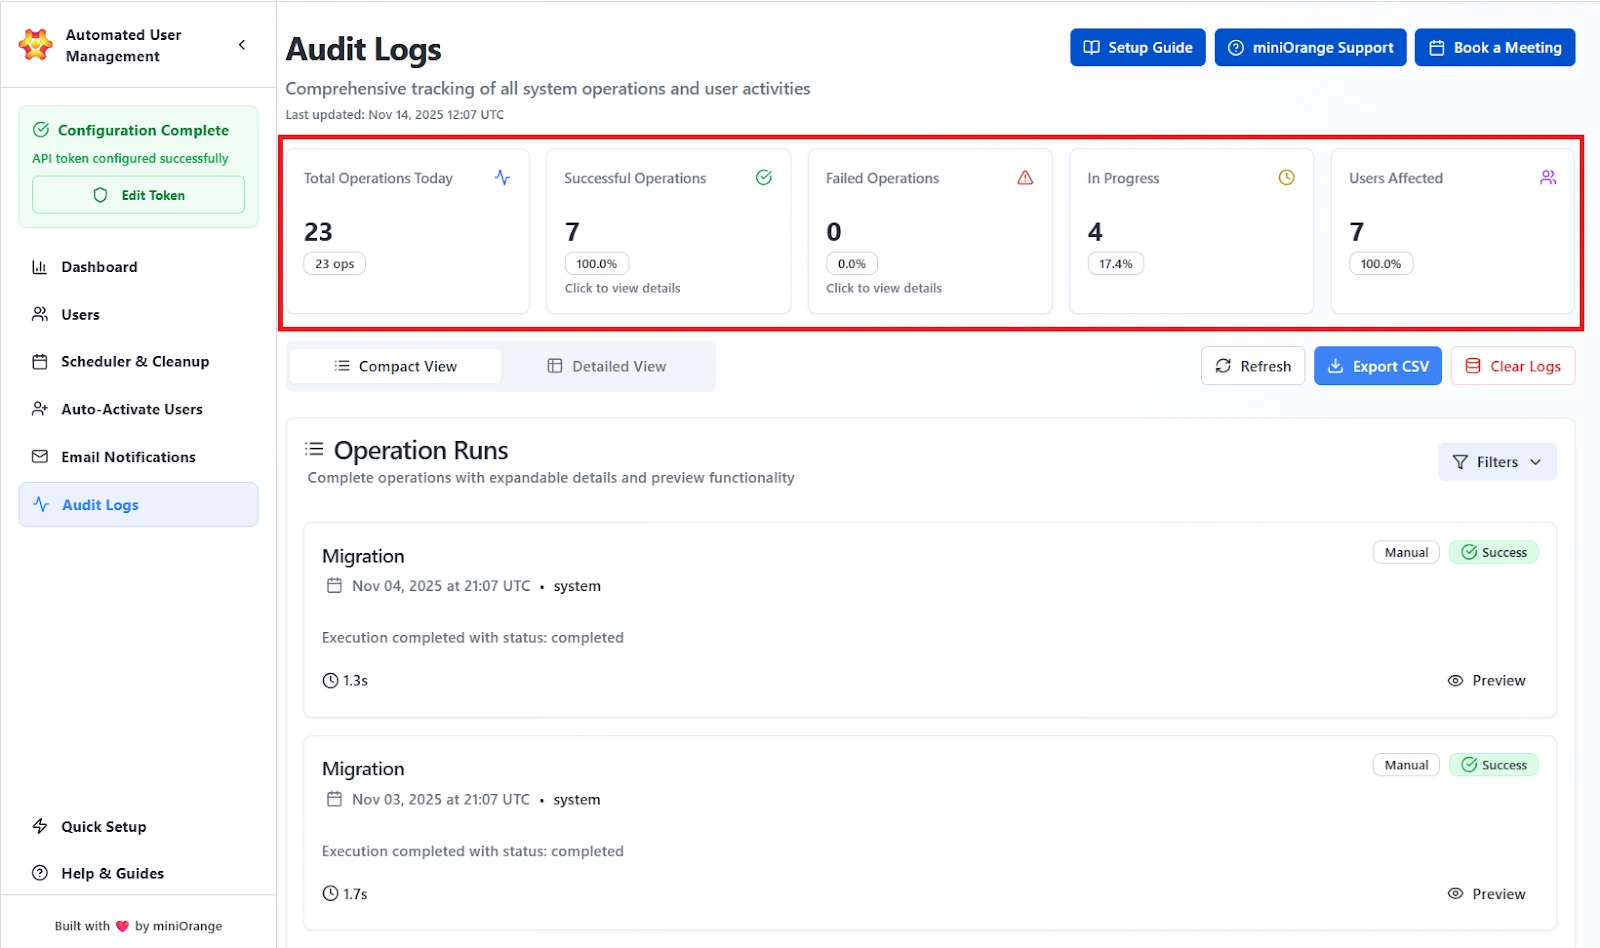
The summary cards give a quick overview of the following information:
- Total Operations Today: Shows the total number of actions the system executed in the last 24 hours. This includes every job, rule run, import, or cleanup action.
- Successful Operation: Displays how many operations completed without errors, along with the success percentage. This tells you at a glance whether the system is running smoothly.
- Failed Operations: Shows the number and percentage of operations that failed, typically due to permission issues, missing access, invalid credentials, or API errors. Any spike here needs attention.
- In Progress: Lists operations that are currently running. Useful when you expect a large import or cleanup and need to confirm it hasn’t stalled.
- Users Affected: Shows how many individual user accounts were impacted by today's logged operations. This helps quantify the real impact of the system’s activity.
The following controls are also provided:
- Refresh: Updates the dashboard with the latest log data.
- Export CSV: Downloads all audit logs for offline analysis.
- Clear Logs: Permanently deletes all audit and execution records (confirmation required).
Click on any of the cards opens an expanded view displaying all affected users and their outcomes. The detailed preview shows the following details:
- User Email: Email address of each affected user.
- Action: The task performed on the user (e.g., Suspend, Restore).
- Status: Result of the operation (Success, Failed).
- Group: Group associated with the action (if relevant).
- Details: Summary of results or failure reason.
Operation Runs with Compact view title
The Operation Runs section lists all recorded executions in a chronological timeline, giving administrators insight into how and when key operations occurred.
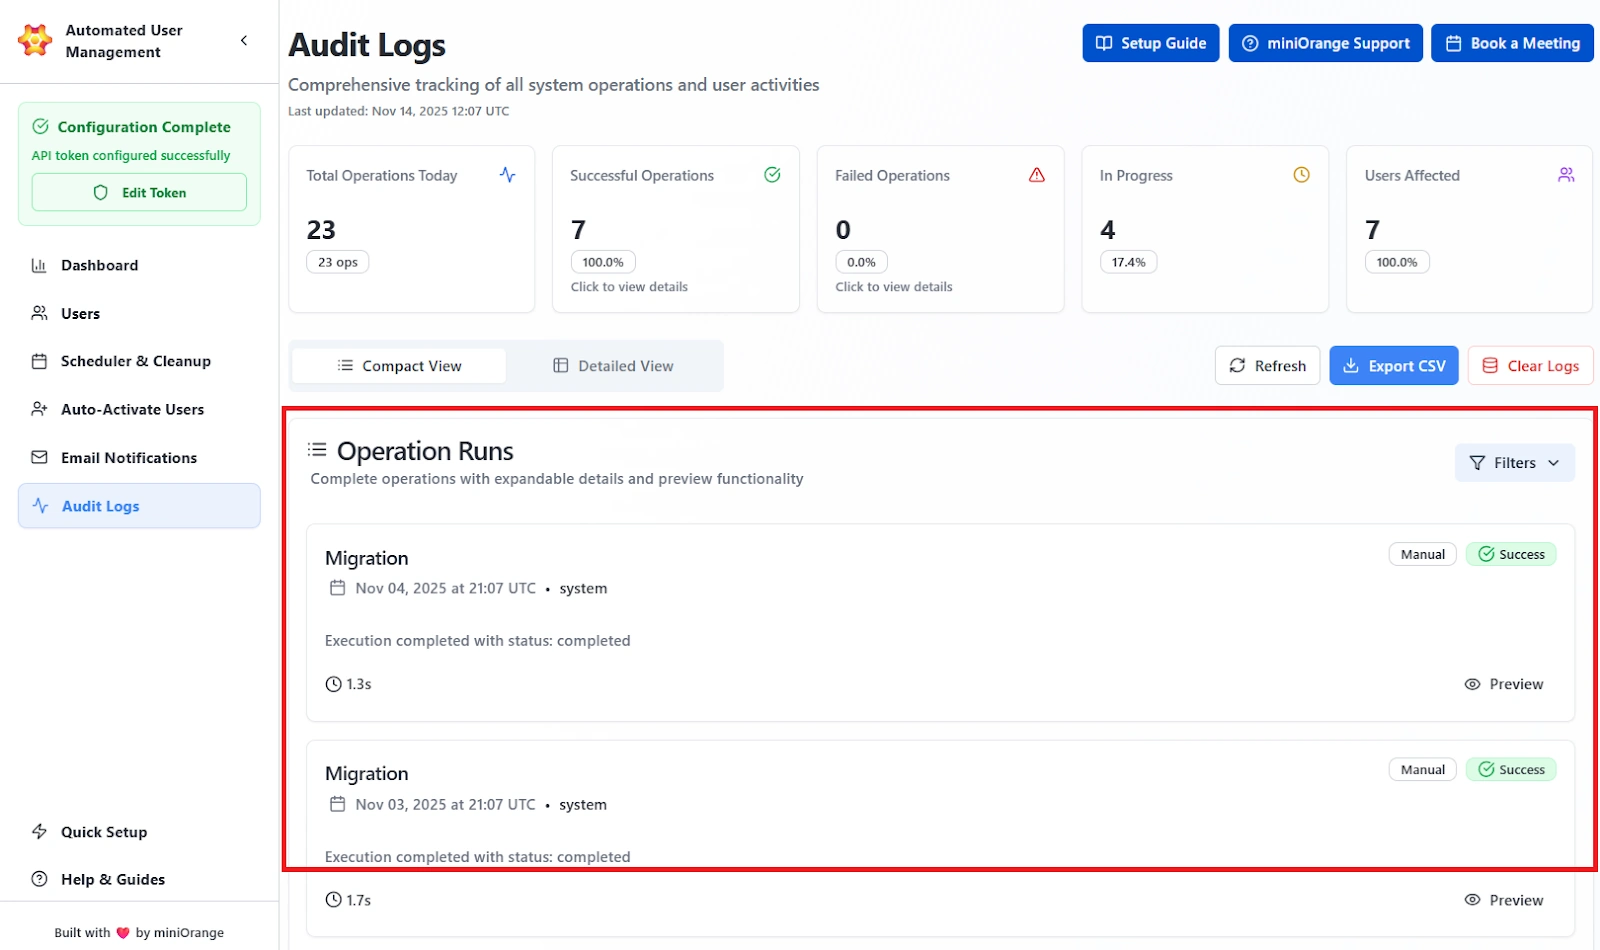
Here are the details that are shown per operation:
- Operation Name: Shows the exact type of task that was performed, such as Migration, User Suspension, or Cleanup. This tells you immediately what the system executed.
- Timestamp: Displays the exact UTC time when the operation finished. Useful for audits and verifying scheduled runs.
- Initiator: Indicates who triggered the operation:
- Manual: An admin started it.
- Automated: A scheduler or rule ran it on its own.
- Status: Shows whether the operation succeeded, failed, produced a warning, or is still in progress.
- Execution Time: Shows how long the operation took to complete, down to the second. Useful for spotting delays or system issues.
- Preview Option: Expands the entry to reveal the full details of the operation, including user counts, errors, and step-by-step results.
Detailed View
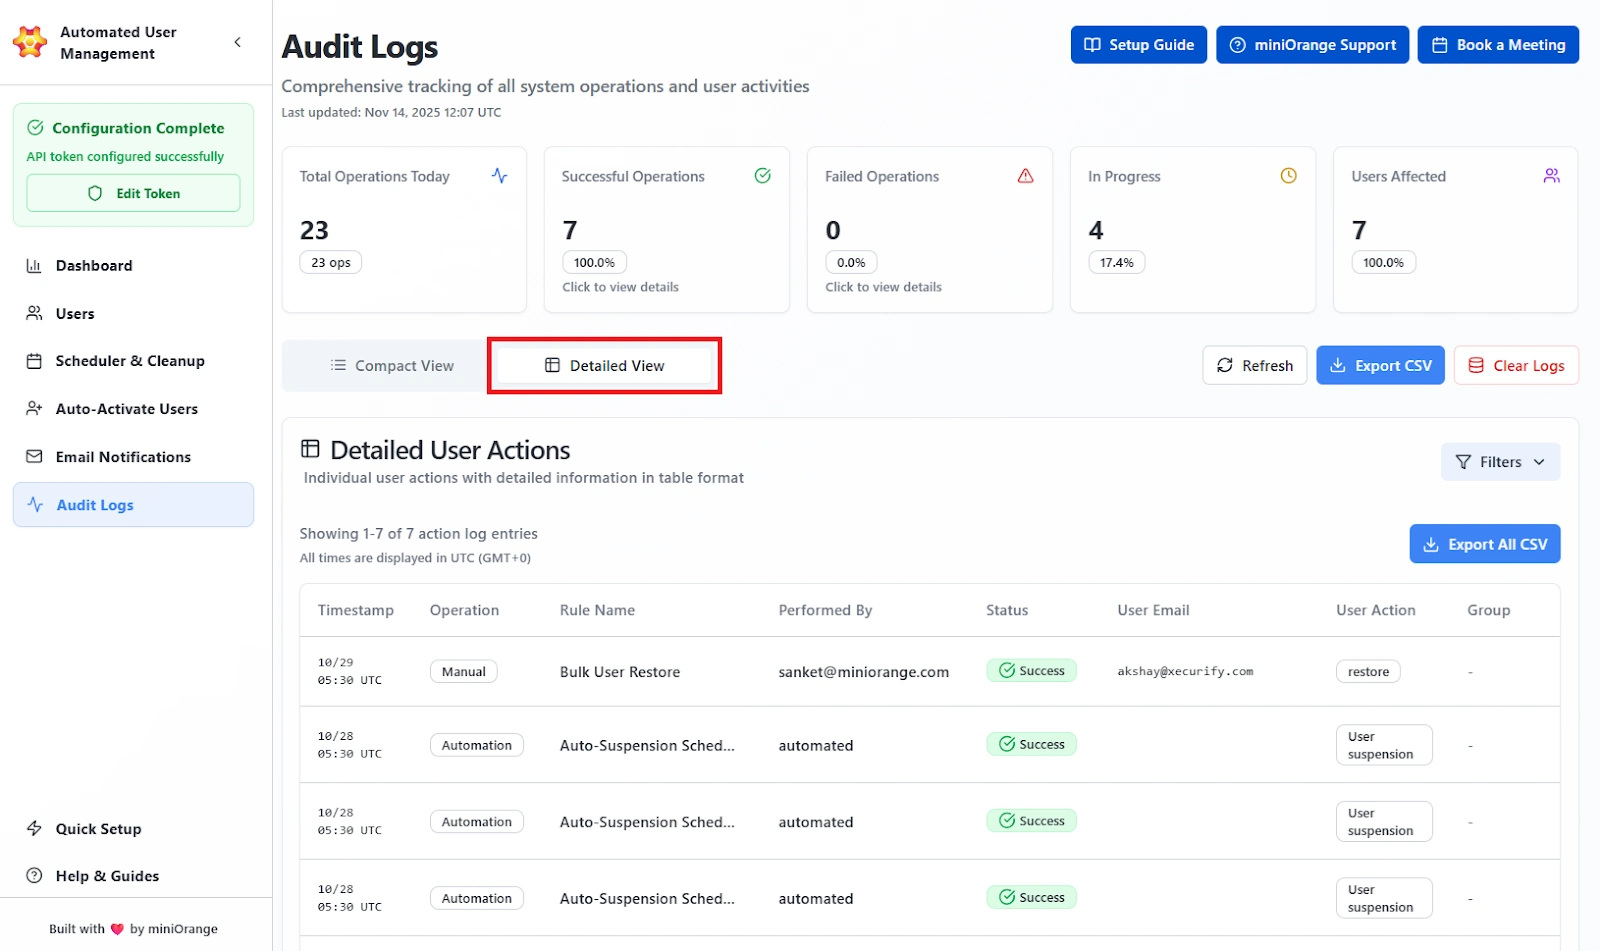
Switching to Detailed View displays granular information about each individual user action recorded during operations. The admin will be able to view the following information in this section:
- Timestamp: When the action was executed (in UTC).
- Operation: The type of process executed (e.g., Bulk Import, Auto-Suspension).
- Rule Name: The rule or job name associated with the operation.
- Performed By: Identifies who or what triggered the action (manual admin name or “automated”).
- Status: Indicates the action result (Success, Failed, Partial Failure).
- User Email: The email ID of the affected user.
- User Action: Describes the operation performed (e.g., Restore, Suspend, Delete).
- Group: The group related to the operation (if applicable).
Advanced Filters
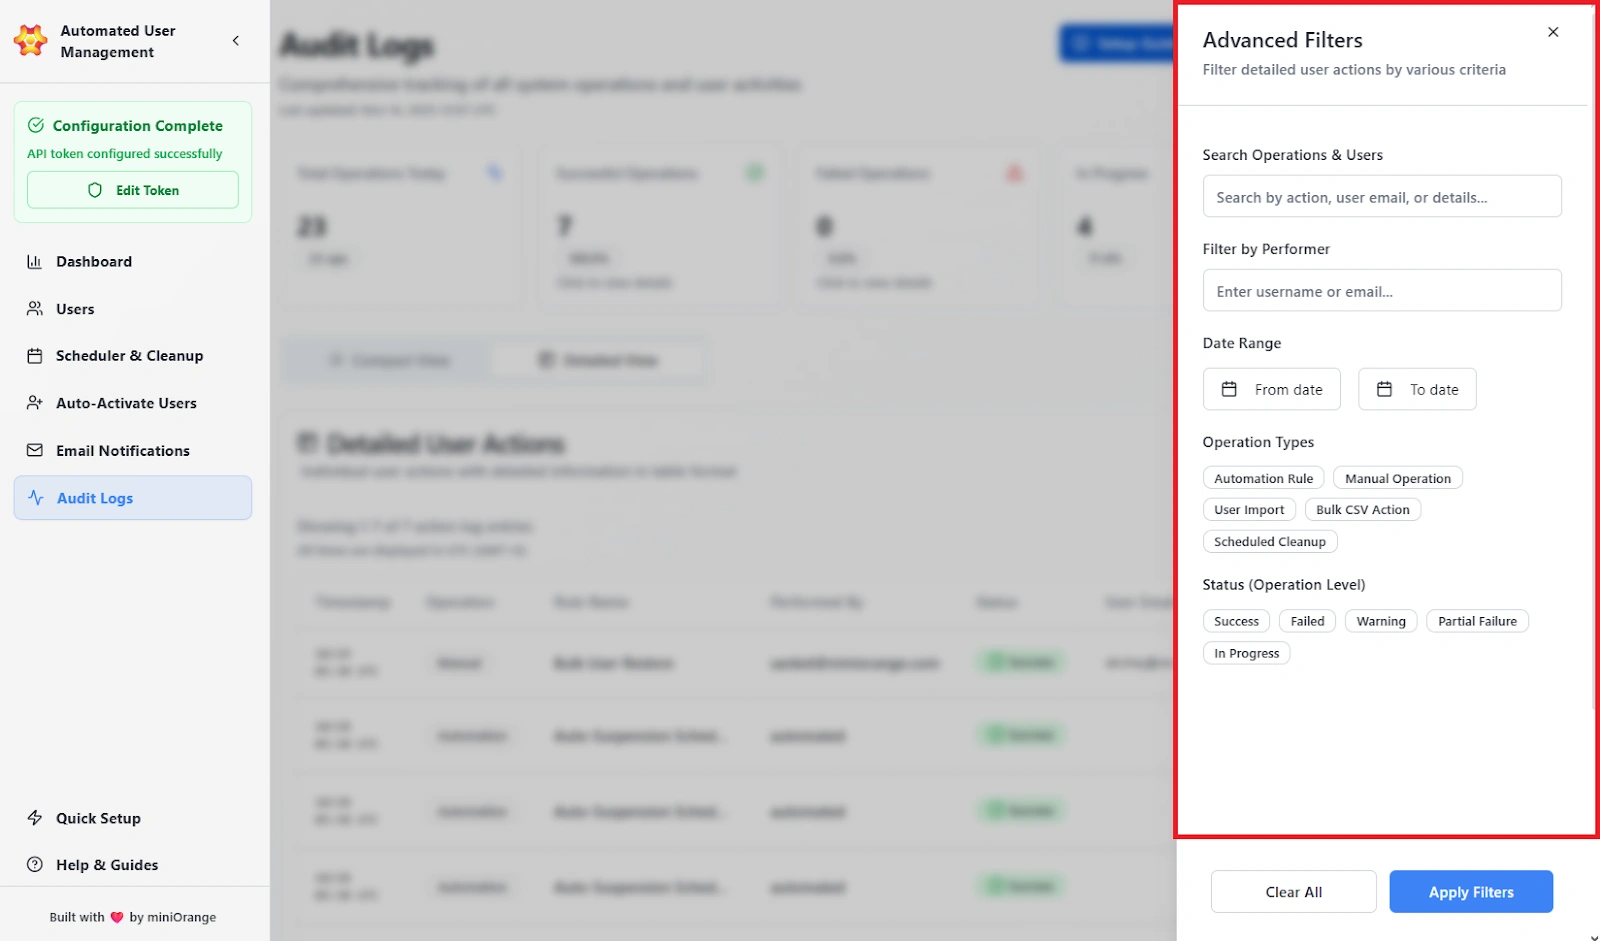
The Filters panel refines the displayed results based on defined criteria, allowing admins to locate specific actions or investigate issues efficiently. The filters available are as follows:
- Search Operations: Search by operation type, rule name, or keywords.
- Filter by User / Performer: Filter logs by username or email.
- Date Range: Define a start and end date for the activity timeline.
Operation Types:
- Automation Rule
- Manual Operation
- User Import
- Bulk CSV Action
- Scheduled Cleanup
Status:
- Success
- Failed
- Warning
- Partial Failure
- In Progress
The admins can apply the chosen filters to view the logs that are required. When they click on Clear All, they will be able to remove all active filters.
Export Options
The audit logs can be exported in CSV format with UTC timestamps and all data fields.
Clear Logs
Administrators can delete all audit and action logs by selecting Clear Logs.
Use Case Scenario
You need to verify that last night’s cleanup rule suspended the correct users and didn’t touch anyone outside the intended criteria.
How it works
- Open Audit Logs.
- Apply filters:
- Operation Type: Scheduled Cleanup
- Status: Success
- Date: Yesterday
- Expand the matching operation to view the full list of impacted users.
- Export the log if you need to send the results to compliance, security, or internal audit teams.
Benefit
Audit Logs give complete, timestamped traceability for every automated and manual action. They make it easy to verify correct behavior, investigate issues, and provide solid evidence during compliance checks. Every decision and outcome is documented and reviewable.